For this edition, I explore some areas of climate evolution in eastern China, roughly covering the agricultural zones. The graphs below were produced with the aid of Giovanni, a data portal run by NASA GES DISC. I used the Modern Era Retrospective Analysis dataset of monthly records gridded on 2/3 x 1/2 degree. Please send questions or comments to sidd@situ.com
For a global look at precipitation patterns, see here .
If you were looking for the last post on orbital orrery,here it is.
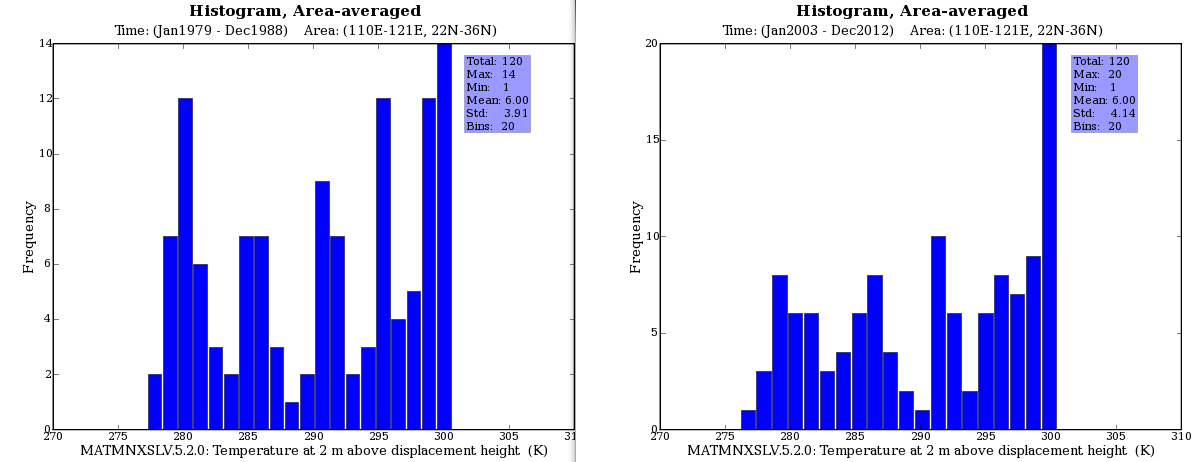
The graphs below are histograms for 2m temperature in E. China. The x axes are in Kelvin. The incidence of cooler months has dropped in three decades.
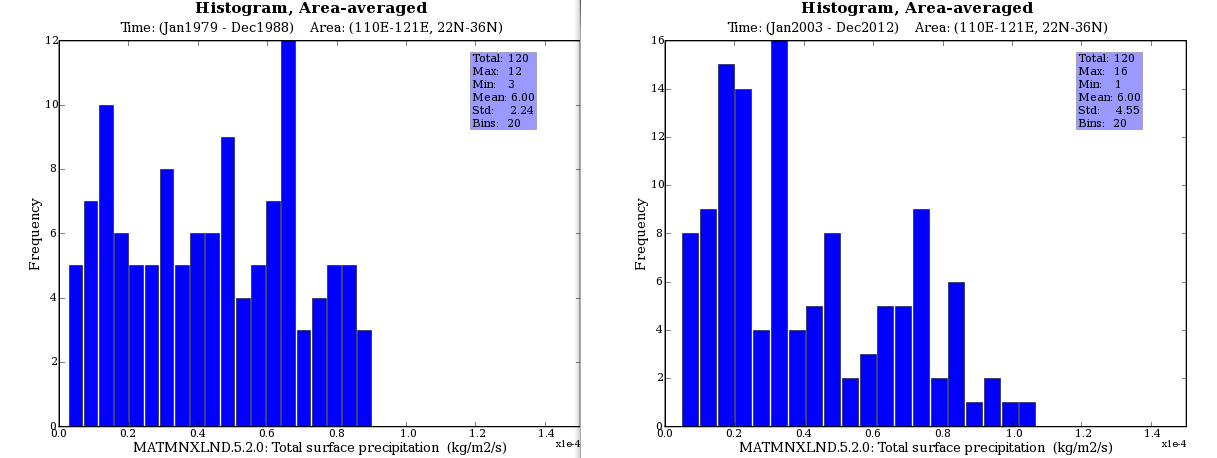
The graphs below are histograms for surface precipitation in E. China. One unit on the x axes is about 10"/month of rain. The incidence of both drier and wetter months increased in 30 years.The distribution also broadens toward higher precipitation months.
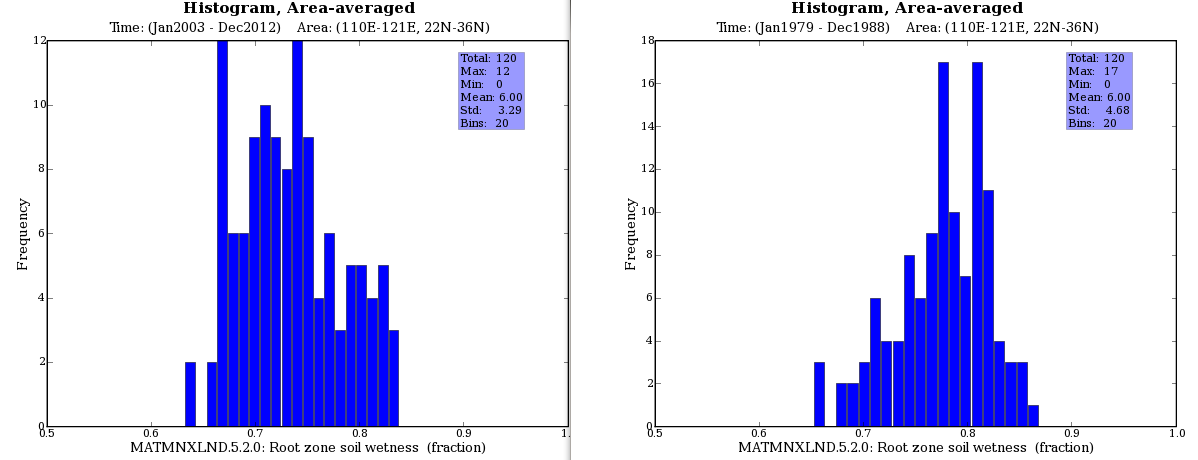
The next set of graphs compares the moisture fraction in the root zone. We see the root zone getting more moist.
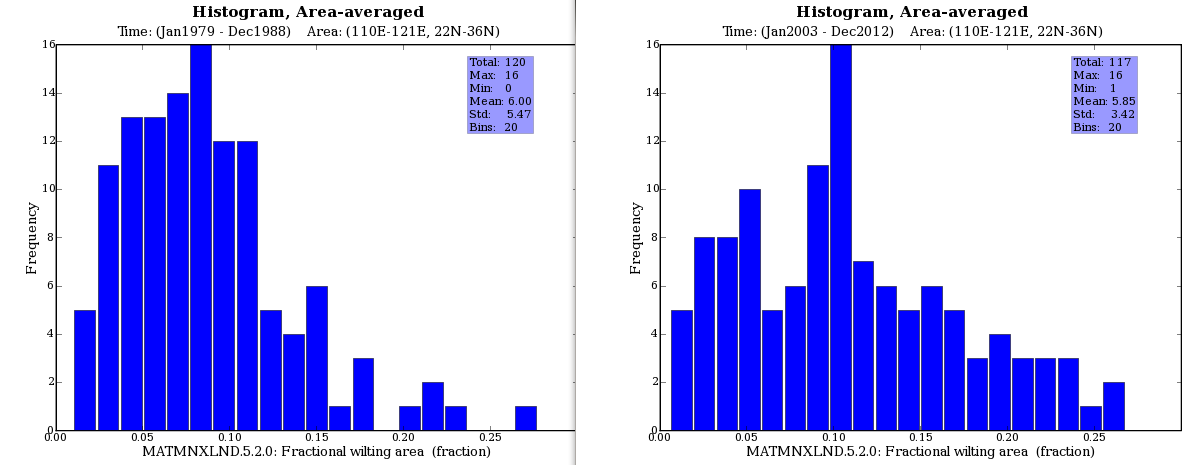
The next set of graphs compares the fractional area of wilted vegetation. We see an increase over the 30 year period.
These have interesting implications for agriculture, forestry, wildlife and humans.