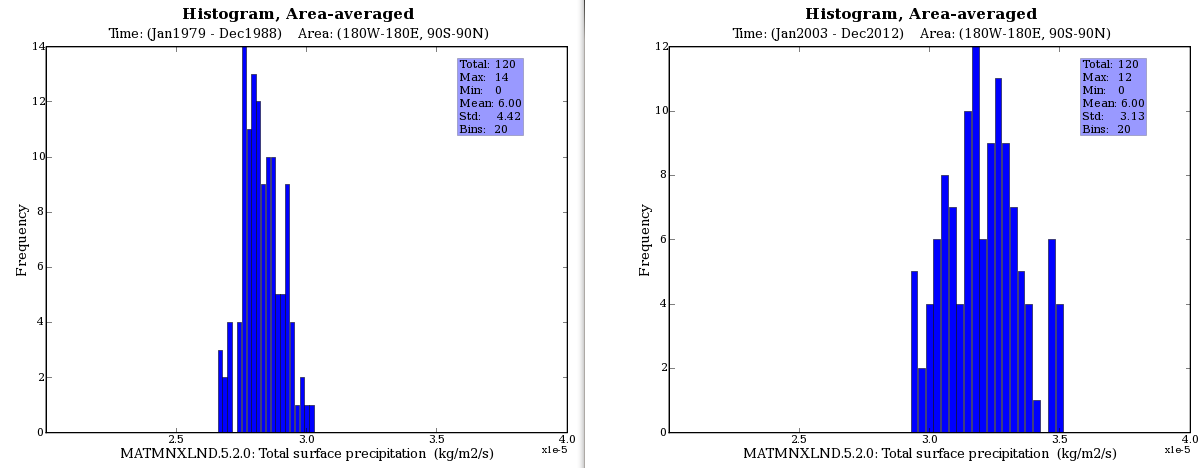
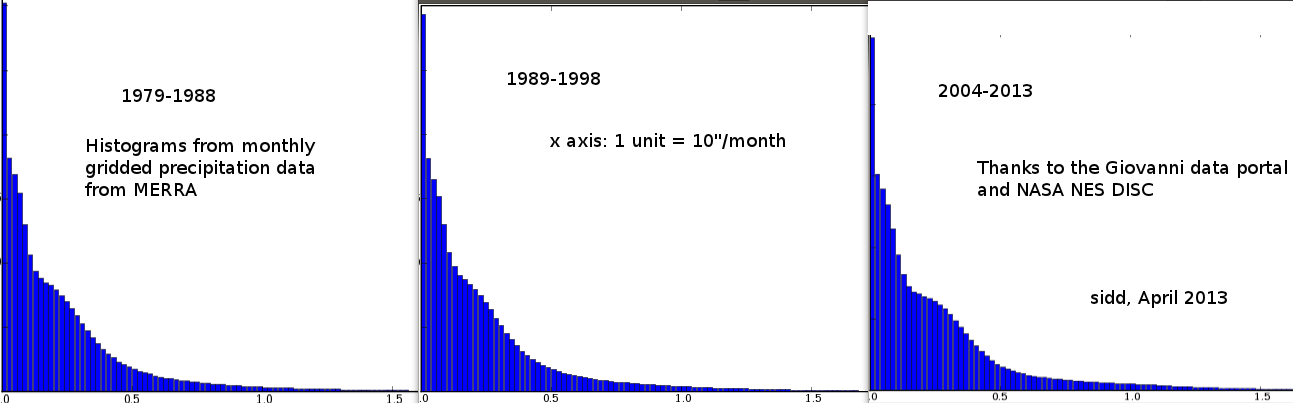
These are histograms of the monthly precipitation worldwide for 1979-1988 and 2003-2012 from MERRA, made by my new best friend, Giovanni, the data portal cared for by NASA NES DISC
The x axes units are roughly an inch a month.
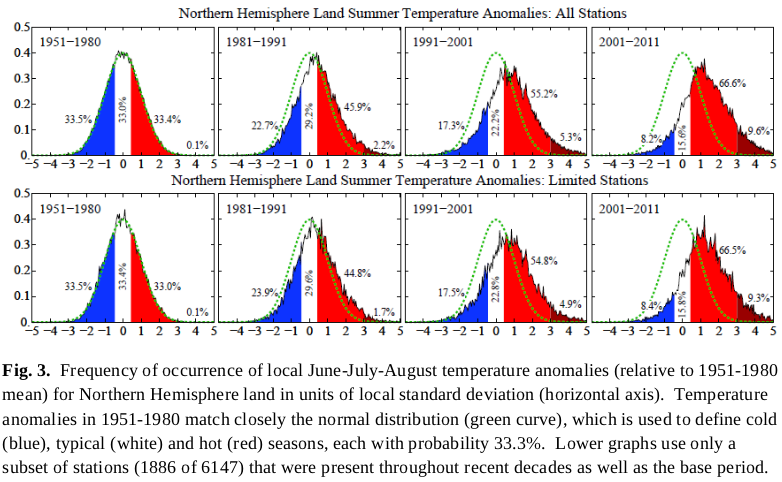
Amazing, isn't it? The distribution has broadened and shifted to the right, just like in the temperature data exhibited by Hansen in 2011 in the climate dice paper, Cimate Dice and updated at http://www.nasa.gov/pdf/719139main_2012_GISTEMP_summary.pdf
For a look at patterns in E. China see here .